Saturday, December 18, 2010

MCX NICKEL TECHNICAL LONG-TERM OUTLOOK

Date: 18 December 2010

MCX NICKEL TECHNICAL LONG-TERM OUTLOOK

TECHNICAL OVERVIEW:
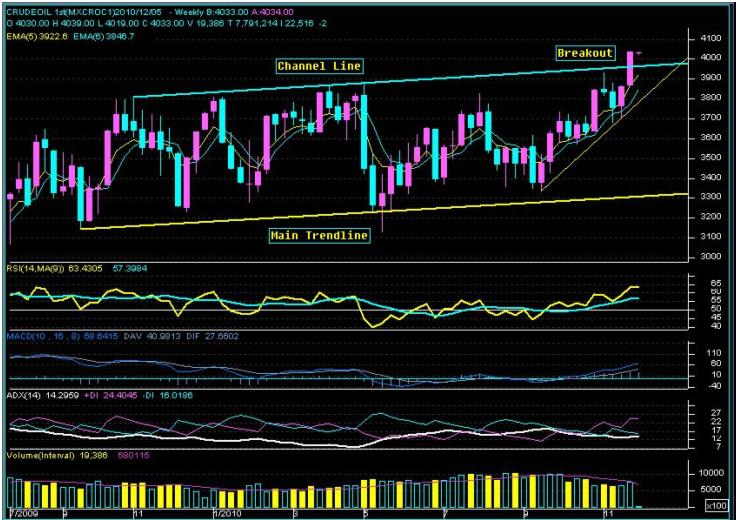
MCX Nickel prices have spiked up sharply in the last week closing up 4.35% from its previous week’s closing of 1085.10. Looking at the weekly chart the counter has given Bullish Symmetrical Triangular breakout by breaching a resistance of 1120.00.

We expect BULL trend to follow in Nickel in the long term Target Rs.1465.00
NICKEL WEEKLY CHART:


Observations:

• After a long consolidation between 1120.00 and 958.00 for last 10 weeks, the counter has finally breached the 1120.00 resistance and closed above 1130.00. Prices are in positive momentum as long as holds above 1024.00

• The RSI is trading above 60 and has potential to move up further with supporting average and trend line. The breakout should occur with an expansion in volume, especially on upside breakouts.

• MACD holding above the zero line for a long time, indicating a good up moves ahead.

• Last but not the least; Directional Index too has given positive cross over in +DI and -DI, rising ADX suggesting a start of a new Up trend ahead.


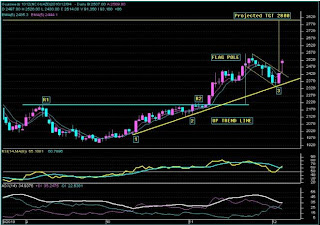
TRUE INFOTEC: MCX NICKEL LONG TERM VIEW:

POSITIONAL CALL (3 TO 4 MONTHS): BUY NICKEL MCX 1105-1130 ZONE FOR
THE TARGET 1ST 1300.00 & TARGET 2ND 1465.00 WITH SL OF 1020.00, CMP 1130.00

************************************************
Report By: Pradeep Karnani
Research Analyst
Mobile: 09966028055
*********************************************

FOR PRIVATE CIRCULATION ONLY
DISCLAIMER:
Stock & Commodity trading is a high-risk movement. The above recommendations are based on Technical Analysis. Any major fundamental news or market sentiment can make these levels irrelevant or unsuccessful. The targets and time frame for the same mentioned above are indicative and may vary depending upon the market situation. Receivers are urged to exercise their own judgment in trading. Any action you choose to take in the markets is totally your own responsibility. We (TRUE INFOTEC) will not be liable for any, direct or indirect, consequential or incidental damages or loss arising out of the use of this information. This information is neither an offer to sell nor solicitation to buy any of the commodities mentioned herein the writers may or may not be trading in the securities mentioned.
-----------------------------------------------------------------------------------------
TRUE INFOTEC: 101, VICTORY SATYANARAYANA, OLD BOWNPALLI, HYDERABAD-500011
TEL: 040-40271150, 9966028055 EMAIL info@trueinfotec.in
www.trueinfotec.in

Monday, December 13, 2010

MCX COPPER TECHNICAL LONG-TERM OUTLOOK

Date: 13 December 2010

MCX COPPER TECHNICAL LONG-TERM OUTLOOK

TECHNICAL OVERVIEW:

MCX Copper prices have spiked up sharply in the last five months since July 2010 and which has given a neckline breakout at Rs 388.05 in Nov 2010 on the closing basis. The Inverted Head and Shoulder formation which has been formed from May 2006 to Oct 2010
Looking at the monthly chart the counter has given Inverse Head and Shoulders breakout by breaching a resistance of 388.00.We expect bull trend to follow in Copper in the Long Term.

COPPER MONTHLY CHART:


Observations:

• After a very long consolidation between 397.85 and 150.85 for last 4 years and 5 months, the counter has finally breached the 388.00 resistance and closed at 388.05 in Nov 2010.

• The RSI is trading above 75 and has potential to move up further with supporting average and trend line.

• MACD holding above the zero line for a long time, indicating a good move ahead.

• Last but not the least; Directional Index too has given positive cross over in +DI and -DI, and rising ADX suggesting a start of a new Up trend ahead


TRUE INFOTEC: MCX COPPER LONG TERM VIEW:

COPPER MCX FOR 2-3 YEARS PERSPECTIVE, WE EXPECT STRONG PULL BACK FOR THE MAJOR MOVE TOWARDS Rs 616.60 /KG, CMP Rs 417.00 /KG

------------------------------------------------------------------
Report By: Pradeep Karnani
Research Analyst Mobile: 09966028055
--------------------------------------------------------
FOR PRIVATE CIRCULATION ONLY
DISCLAIMER:
Stock & Commodity trading is a high-risk movement. The above recommendations are based on Technical Analysis. Any major fundamental news or market sentiment can make these levels irrelevant or unsuccessful. The targets and time frame for the same mentioned above are indicative and may vary depending upon the market situation. Receivers are urged to exercise their own judgment in trading. Any action you choose to take in the markets is totally your own responsibility. We (TRUE INFOTEC) will not be liable for any, direct or indirect, consequential or incidental damages or loss arising out of the use of this information. This information is neither an offer to sell nor solicitation to buy any of the commodities mentioned herein the writers may or may not be trading in the securities mentioned.

TRUE INFOTEC: 101, VICTORY SATYANARAYANA, OLD BOWNPALLI, HYDERABAD-500011
TEL: 040-40271150, 9966028055 EMAIL info@trueinfotec.in http://www.trueinfotec.in/

Monday, December 6, 2010

MCX CRUDE OIL TECHNICAL OUTLOOK

Date: 6 December 2010

MCX CRUDE OIL TECHNICAL OUTLOOK

TECHNICAL OVERVIEW:

Looking at the weekly chart of crude oil the counter has given Rectangle (continuation) Bullish break above resistance of 3930 signals that the previous advance will be resumed. We expect bull trend to follow in MCX crude oil in short to medium term for the target of 4400 in short term and 4600 in the medium term.


CRUDE OIL WEEKLY CHART:


Observations:

• Crude oil has given a breakout on closing basis on the weekly chart after one year and 10 weeks consolidation which is indicating a major move ahead in the next 2-3 months.

• The RSI (14/9) is trading above 60 and has potential to move up further, with supporting average. The breakout should occur with an expansion in volume, especially on upside breakouts.

• MACD holding above the zero line for a long time, indicating a good move ahead.

• Last but not the least; Directional Index too has given rising distance in +DI and -DI, suggesting a start of a new trend ahead.


TRUE INFOTEC: POSITIONAL CALL (2-3 MONTHS): BUY CRUDE OIL MCX DEC 3970-4030 TGTS 4400-4600 SL 3700 ON THE CLOSING BASIS, CMP 4030

-----------------------------------------------------------
Report By: Pradeep Karnani
Research Analyst
Mobile: 09966028055
----------------------------------------------------------
FOR PRIVATE CIRCULATION ONLY
DISCLAIMER
: Stock & Commodity trading is a high-risk movement. The above recommendations are based on Technical Analysis. Any major fundamental news or market sentiment can make these levels irrelevant or unsuccessful. The targets and time frame for the same mentioned above are indicative and may vary depending upon the market situation. Receivers are urged to exercise their own judgment in trading. Any action you choose to take in the markets is totally your own responsibility. We (TRUE INFOTEC) will not be liable for any, direct or indirect, consequential or incidental damages or loss arising out of the use of this information. This information is neither an offer to sell nor solicitation to buy any of the commodities mentioned herein the writers may or may not be trading in the securities mentioned.

TRUE INFOTEC: 101, VICTORY SATYANARAYANA, OLD BOWNPALLI, HYDERABAD-500011
TEL: 040-40271150, 9966028055 EMAIL info@trueinfotec.in
http://www.trueinfotec.in

Saturday, December 4, 2010

GUAR SEED TECHNICAL OUTLOOK

Date: 4 December 2010

GUAR SEED TECHNICAL OUTLOOK

TECHNICAL OVERVIEW:

Looking at the daily chart the counter has given short-term continuation bullish flag break above resistance of 2480 signals that the previous advance has resumed. We expect bull trend to follow in Guar Seed in the near term.

GUAR SEED DAILY CHART


Observations:

• After a 09 days consolidation in a sideways to down flag formation (small rectangle pattern that slopes against the previous trend), Guar Seed breached the resistance of 2500 and gave a strong daily closing above 2510 levels.

• A doji candle on 02 Dec 2010 has given the third point of trend line, which is confirmed the Long Term up TREND.

• The RSI is trading above 65 and has potential to move up further. Fast Stochastic Oscillator too has given a positive cross over which is likely to support the upside momentum.

• Last but not the least; Directional Index too has given positive cross over in +DI and -DI, indicating the positive momentum in the prices.


POSITIONAL BUY CALL: BUY GUAR SEED NCDEX DEC 2470-2500 ZONE FOR THE TARGET 1ST 2700 AND TARGET 2ND 2800 WITH SL OF 2350,CMP 2505


------------------------------------------------------------
Report By: Pradeep Karnani
Research Analyst Mobile: 09966028055
------------------------------------------------------------


FOR PRIVATE CIRCULATION ONLY
DISCLAIMER: Stock & Commodity trading is a high-risk movement. The above recommendations are based on Technical Analysis. Any major fundamental news or market sentiment can make these levels irrelevant or unsuccessful. The targets and time frame for the same mentioned above are indicative and may vary depending upon the market situation. Receivers are urged to exercise their own judgment in trading. Any action you choose to take in the markets is totally your own responsibility. We (TRUE INFOTEC) will not be liable for any, direct or indirect, consequential or incidental damages or loss arising out of the use of this information. This information is neither an offer to sell nor solicitation to buy any of the commodities mentioned herein the writers may or may not be trading in the securities mentioned.


TRUE INFOTEC: 101, VICTORY SATYANARAYANA, OLD BOWNPALLI, HYDERABAD-500011
TEL: 040-40271150, 9966028055 EMAIL info@trueinfotec.in
http://www.trueinfotec.in/